GeoDa
An Introduction to Spatial Data Science
Introducing GeoDa 1.22
GeoDa is a free and open source software tool that serves as an introduction to spatial data science. It is designed to facilitate new insights from data analysis by exploring and modeling spatial patterns.
GeoDa was developed by Dr. Luc Anselin and his team. The program provides a user-friendly and graphical interface to methods of exploratory spatial data analysis (ESDA), such as spatial autocorrelation statistics for aggregate data (several thousand records), and basic spatial regression analysis for point and polygon data (tens of thousands of records). To work with big data in GeoDa it should first be aggregated to areal units.
Since its initial release in February 2003, GeoDa's user numbers have increased exponentially to over 520,000 (June 2022). This includes lab users at universities such as Harvard, MIT, and Cornell. The user community and press embraced the program enthusiastically, calling it a "hugely important analytic tool," a "very fine piece of software," and an "exciting development."
The latest version 1.22 contains multi-layer support, several new local cluster features, including univariate and multivariate local Geary cluster maps, redcap, skater, spectral clustering and max-p, and local join count maps for categorical data. It also implements several classic non-spatial cluster techniques (principal component analysis, k-means, and hierarchical clustering) implemented in Hoon et al.'s (2013) C Clustering Library, as well as HDBScan.
A new workbook is under development. In the meantime, here are interim resources, including an overview of features in 1.22.
GeoDa 1.22
GeoDa runs on Windows, MacOSX and Linux (Ubuntu)


GeoDa Now Supports More Spatial Data Formats
GeoDa now supports a larger variety of vector data in different formats (click here to see the details): You can work with shapefiles, geodatabases, GeoJSON, MapInfo, GML, KML, and other vector data formats supported by the GDAL library. The program also converts coordinates in table format (.csv, .dbf, .xls, .ods) to one of these spatial data formats and converts data between different file formats (such as .csv to .dbf or shapefile to GeoJSON). Selecting a subset and exporting it as a new file is now also possible.

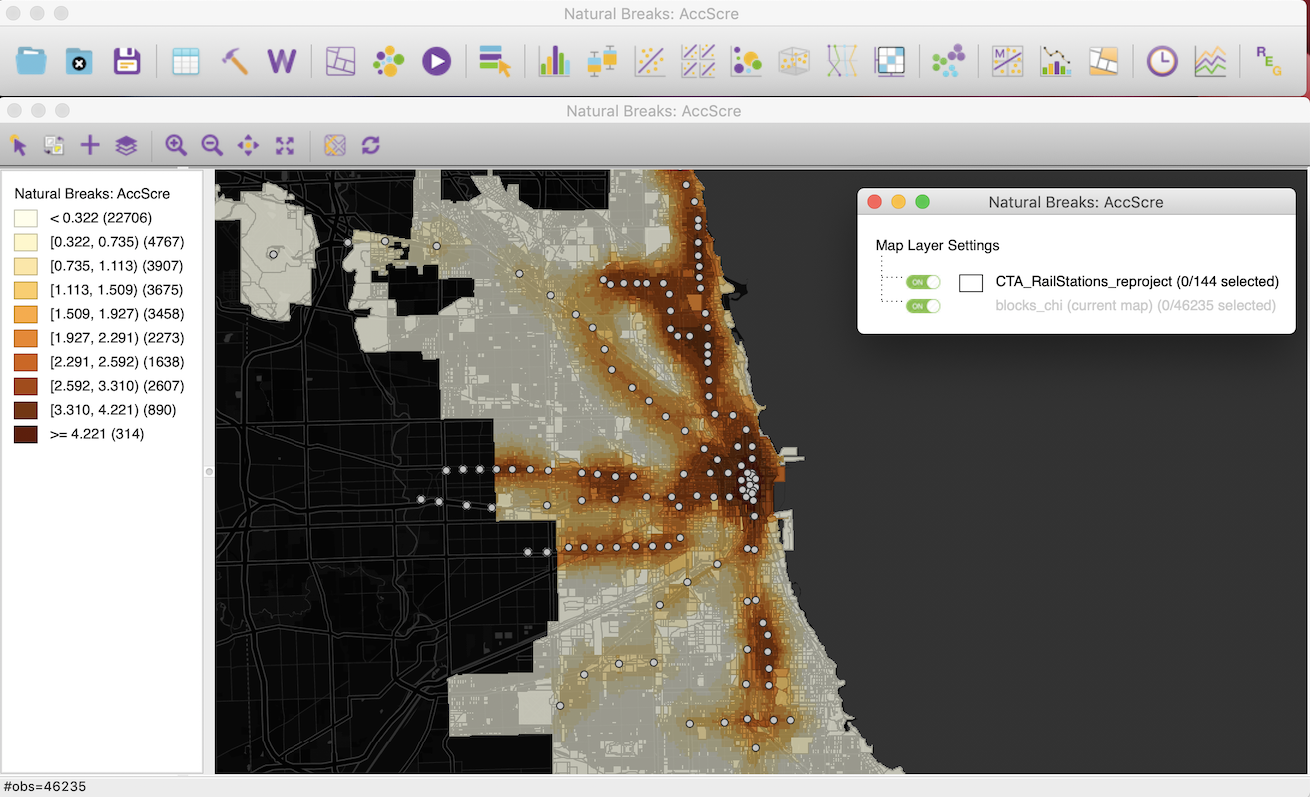
Now With Multi-layer Support!
For the first time, you can now load additional layers into Geoda for visualization purposes. The analysis will still be done on the layer you load first. In this example, the map shows transit access from housing blocks, with the transit station locations as an additional layer.
Explore Statistical Results through Linked Maps and Charts
In contrast to programs that visualize raw data in maps, GeoDa focuses on exploring the results of statistical tests and models through linked maps and charts.

Analyze Spatial and Temporal Patterns Across Linked Views
You can now group the same variable across time periods in the new Time Editor to explore statistical patterns across space and time. Then explore results as views change over time with the Time Player.

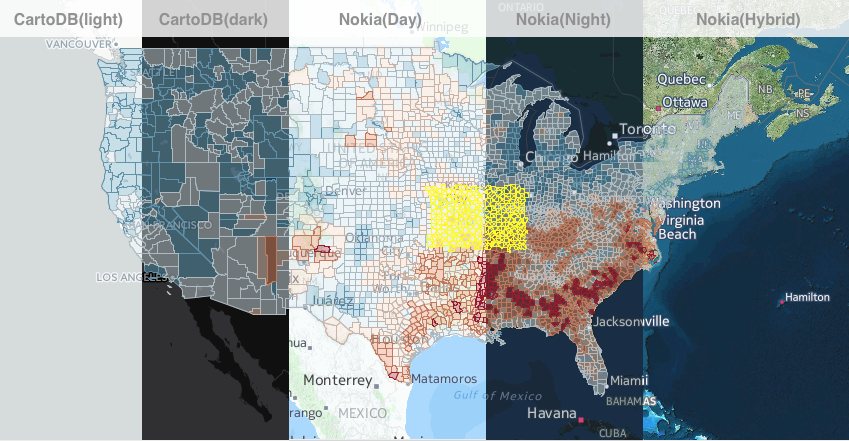
Ground-Truth Map Results with Basemaps
If your spatial data are projected (.prj file), you can now add a basemap to any map view, including cluster maps, for better orientation and for ground-truthing results.
Compare Averages Across Time and Space
A new Averages Chart compares values that are averaged over time and/or space and tests if the differences in these means are significant. For instance, first select if you want to compare means of selected vs. unselected observations in the same time period or compare all observations for different time periods. A basic pre-post/impact-control test then indicates if your results changed over time and space (using an F-test and difference-in-difference test).

Detect Relationships in Multivariate Space
A scatter plot matrix allows you to explore multiple bivariate correlations at once. In this example, the regression slopes for selected, unselected and all police precincts in San Francisco are shown to explore relationships between four types of crime.

Find Statistically Significant Spatial Clusters
GeoDa has long supported uni-and bivariate local tests of spatial autocorrelation like local Moran. Now the program also includes local G/G*, and a variety of local join count statistics for categorical data. In this example, local Moran cluster maps identify higher % GOP votes in central US areas in both the 2012 and 2016 presidential elections (left). The colocation join count map (top right) shows which of the high-high cluster values in both years overlapped in space while the differential local Moran map reveals clusters in % point differences between 2016 and 2012 (bottom right).

Compare a Suite of Spatially Constrained Cluster Techniques
GeoDa now has lots of new techniques to identify clusters with spatial constraints, including skater, redcap, max-p, k-means, k-medians, k-medoids, and spectral clustering. Here are a few examples of how foreign-born white residents, foreign-born Hispanic residents and median monthly rents in 2008-2009 in New York are clustered.

Determine if Changes Over Time Are Spatially Clustered
Use a global or local Differential Moran's I test to find out if a variable's change over time in a given location is statistically related to that of its neighbors. For instance, this local (LISA) cluster map shows hotspots in New York with larger changes in the share of kids between 2002 and 2008 (and coldspots with smaller changes).

Test if Multiple Variables Are Clustered in Space
Luc Anselin (2017) recently extended Geary's c with a new local indicator of spatial association. This is applied to the classic data set of "moral statistics" of France (Guerry, 1833) to show significant high and low spatial concentrations of literacy (left map) and significant associations of property crime and literacy (right map).

Map Patterns of Non-Spatial Cluster Statistics
You can now map patterns of several classic non-spatial cluster techniques, including principal component analysis (left maps), k-means (top right), and hierarchical clustering (bottom right) and multi-dimensional scaling. Using the same data as in the example above, the maps below show local clusters of property crime, literacy, and suicide.

Find the Threshold Where Spatial Correlation Ends
A nonparametric spatial autocorrelation test (correlogram) is now available to determine distance thresholds when the values of neighboring pairs are no longer correlated.

Explore the Impact of Flexible Data Categorization
With the new category editor, you can explore how sensitive your results are to changes in the thresholds that categorize your data. In this example the thresholds in the conditional map (right) are based on the categories that can be adjusted in the category editor (left).

Dependencies
GeoDa is released under a GPL license. It builds on several open source libraries and source-code files. Below is the list of the key projects that we would like to acknowledge.
GDAL Libraries, version 1.10
License: X/MIT style Open Source license
Authors: Many
Links: https://www.gdal.org/
Boost Libraries, version 1.53
License: Boost Software License - Version 1.0
Authors: Many
Links: https://www.boost.org/
wxWidgets Cross-Platform GUI Library, version 2.9.4
License: The wxWindows Library Licence
Authors: Julian Smart, Robert Roebling, and others
Links: https://www.wxwidgets.org/
CLAPACK Linear Algebra Libraries, version 3.2.1
License: Custom by University of Tennessee
Authors: Many
Links: https://www.netlib.org/clapack/
Approximate Nearest Neighbor Library, version 0.1
License: See kNN/AHH.h in included source files
Authors: Sunil Arya and David Mount
Note: Full source of 0.1 release included in kNN directory
Links: https://www.cs.umd.edu/~mount/ANN/
FastArea.c++ source code
License: Unknown
Authors: Daniel Sunday
Note: The source for functions findArea and ComputeArea2D are in the file GenGeomAlgs.h from FastArea.c++ in Journal of Graphics Tools, 7(2):9-13, 2002
Links: https://jgt.akpeters.com/papers/Sunday02/FastArea.html
logger.h source code
License: Boost Software License - Version 1.0
Authors: Seweryn Habdank-Wojewodzki
Note: We have copied the source for logger.h and modified it slightly to work with wxString
Links: https://accu.org/index.php/journals/1304
nullstream.h source code
License: See logger.h in included source files
Authors: Maciej Sobczak
Links: https://www.msobczak.com/
The C Clustering Library
License: Python License
Authors: Hoon, Michiel de, Seiya Imoto, Satoru Miyano. (2013). The University of Tokyo, Institute of Medical Science, Human Genome Center
Links: https://bonsai.hgc.jp/~mdehoon/software/cluster/cluster.pdf
Acknowledgments
The development of GeoDa has most recently been supported by the National Science Foundation, the National Institutes of Health, the National Institute of Justice, and the Agency for Healthcare Research and Quality.
Support
We are currently updating the documentation to reflect the new features in GeoDa 1.22. The Openspace listserv supports technical questions about GeoDa.
License
GeoDa uses a GPL License (General Public License).
Donate
Help us keep GeoDa free by contributing here. Thank you for supporting free and open-source spatial software!
